Top Dog Trading System Course 1
Our first trading course gives you the basics of our methodology and provides the foundation for all of our more advanced techniques taught in later courses.
This course teaches you how to time the market with Swiss Clock precision so you can trade with crystal-clear entries and exits.
The course includes:
- Follow-up email support for your individual questions
- 2 Full-Color Manuals
- 14 Videos
- Online FAQ
Top Dog Trading System Course 2
This course should only be purchased by those who have already purchased our Foundations Course 1 on Cycles and Trends since this course builds on the information in the first course.
This course teaches you how to accurately and confidently read a leading indicator, empowering you to get into the market before the amateurs.
The course includes:
- 2 Full-Color Manuals
- 13 Videos
- Online FAQ
- Follow-up email support for your individual questions
Intermediate Level Course:
Swing Trading with Confidence
My first 2 trading courses give you the basics of my methodology and provide the foundation for all of my more advanced techniques. Now that you’ve been through those 2 courses, you’re ready to start learning the more advanced techniques.
In this course you’ll learn about 2 more “energies” we trade which were not covered in Courses 1 or 2: Volume & Relative Strength. If you’re eager to learn more high-level professional trading approaches, then this is the package for you.
Intermediate Level Course:
Day Trading the Invisible Edge
If you’re eager to learn more high-level professional day trading approaches, then this is the package for you. In day trading you need an “EDGE” over other traders. That “edge” is something you see, and others don’t – and that’s exactly what this course is designed to give you an “Invisible Edge.”
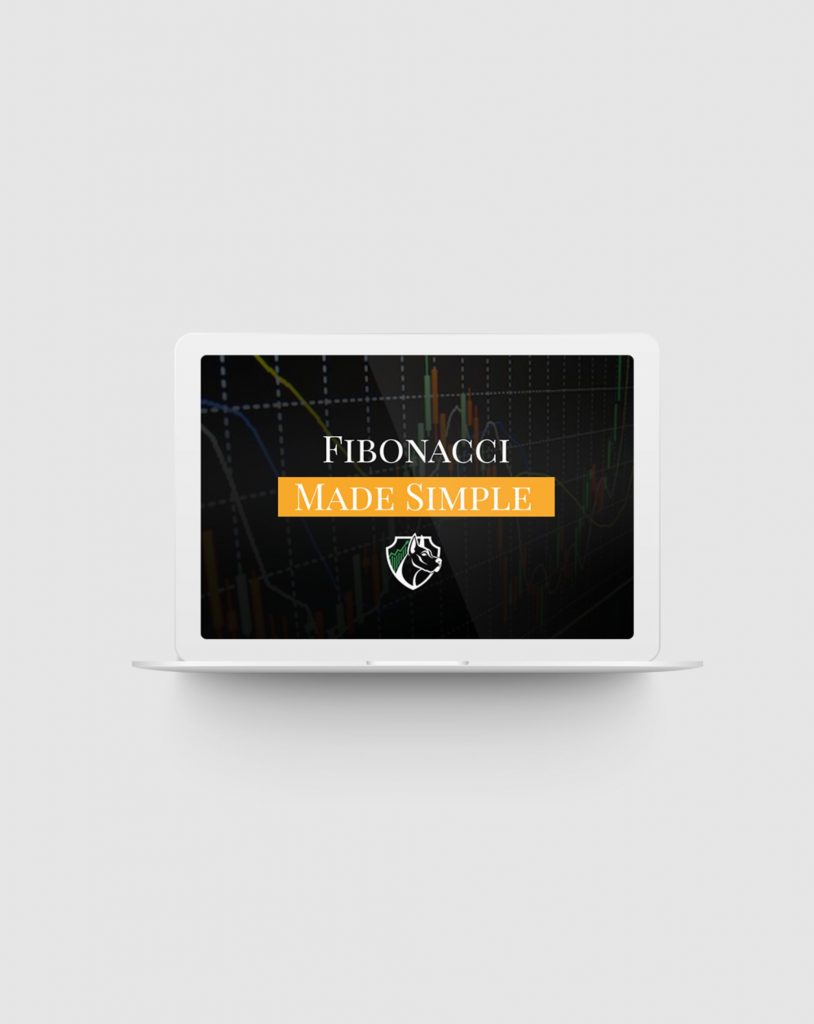
Fibonacci Made Simple
Fibonacci Trading is so popular and used by so many traders that almost every charting program includes Fibonacci drawing tools. Yet most traders don’t know how to use the tools effectively (meaning “profitably”).
Fibonacci numbers are shrouded in mystery and intrigue … and a lot of misunderstanding and misinformation. This course bring clarity and removes the mystery of why Fibonacci trading works so well and exactly HOW to use it.
Go beyond the theory (and the hype) to the practical reality of what actually works in the real world of professional trading.
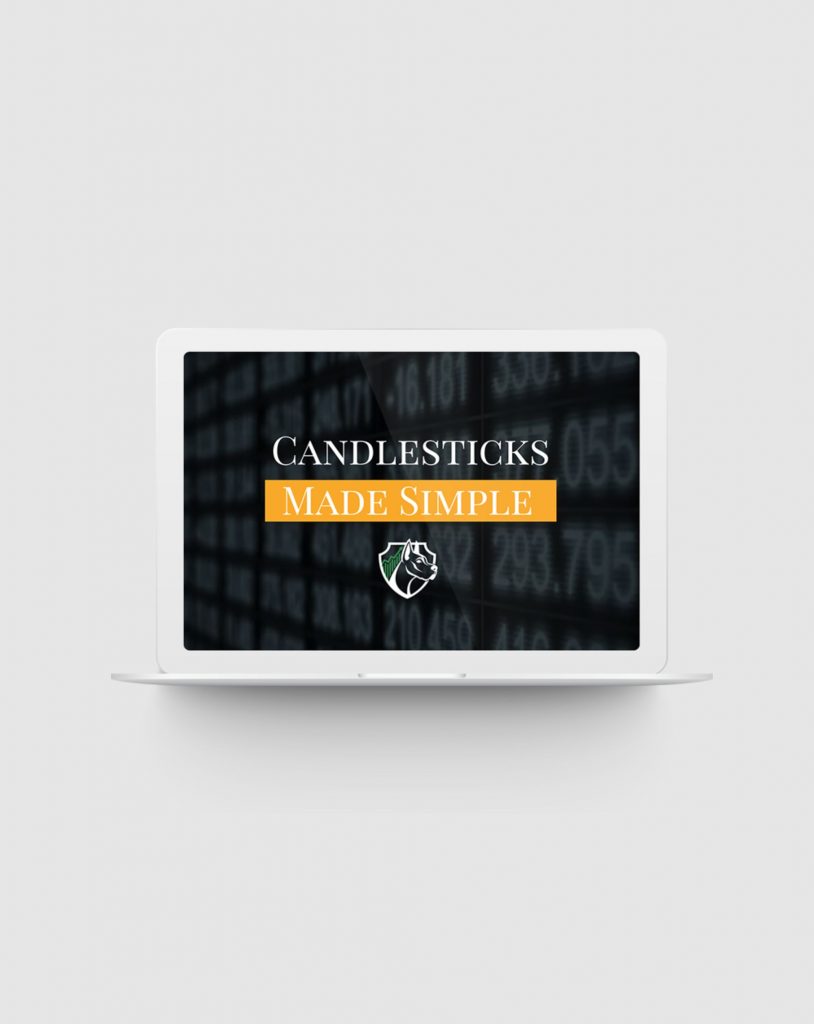
Candlesticks Made Simple
Japanese Candlesticks are so popular and used by so many traders that most every charting program includes the option to use Candlesticks. Yet most traders don’t know how to use them tools profitably.
There are multitudes of Candlestick Patterns with esoteric names and it can be very challenging to memorize them all. But the good news is you don’t have to! Behind the flowery names and their asian mysteries, Candlestick Patterns are actually very logical.
In this course I simplify Candlesticks for you by teaching you the LOGIC behind the patterns. When you understand that, you don’t have to learn all the various configurations by rote memory. You will be able to look at any Candlestick, see the logic behind it, and immediately know what it means! Most importantly, you will learn exactly HOW to use them.

Top Dog Trading Advanced Course
If you want the really ADVANCED TRADING TECHNIQUES, then this is the course for you! This is an all-inclusive course that includes advanced trading techniques for:
- Stock Traders
- Forex Traders
- Future Traders
- Day Traders
- Swing Traders
A pre-requisite for taking this course, is that you must have taken Foundations Courses 1 and 2 first. Other than those two, none of the other courses are required before taking this one.
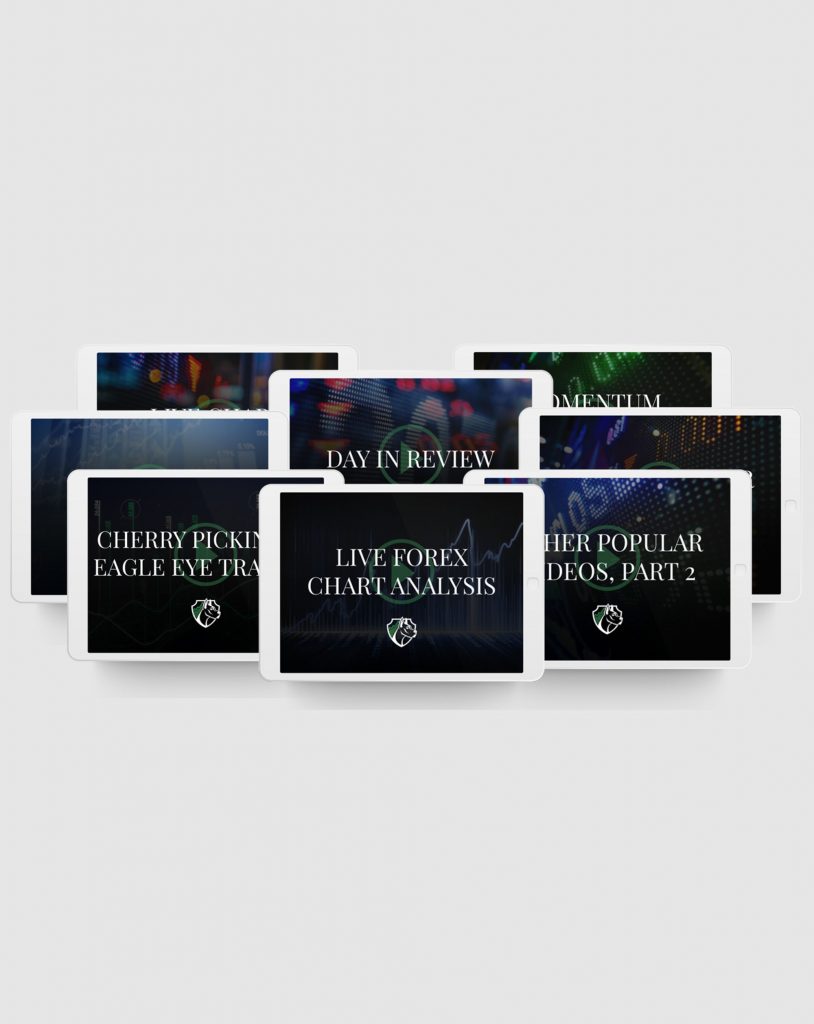
Top Dog Trading’s Most Popular and Important Trading Videos
My Video Newsletter is the best “Continuing Education” tool for the Top Dog Trading methodology. After publishing the videos for several years, students have provided their feedback as to which topics were the most popular and the most helpful for their trading. Now, even if you missed them, you have another chance to get those same videos to help take your trading to the next level.
These videos cover topics such as:
- Live Forex Trading
- Reviews of Entire Trading Days
- Live Bar-by-Bar Chart Analysis
- Momentum Techniques
- Quizzes
- Cherry Picking Trading
- Trading the Fed Announcement
- Parabolic Moves
- Trading Psychology
- The Most Important Thing in Trading
- Pre-Market Preparation and more!
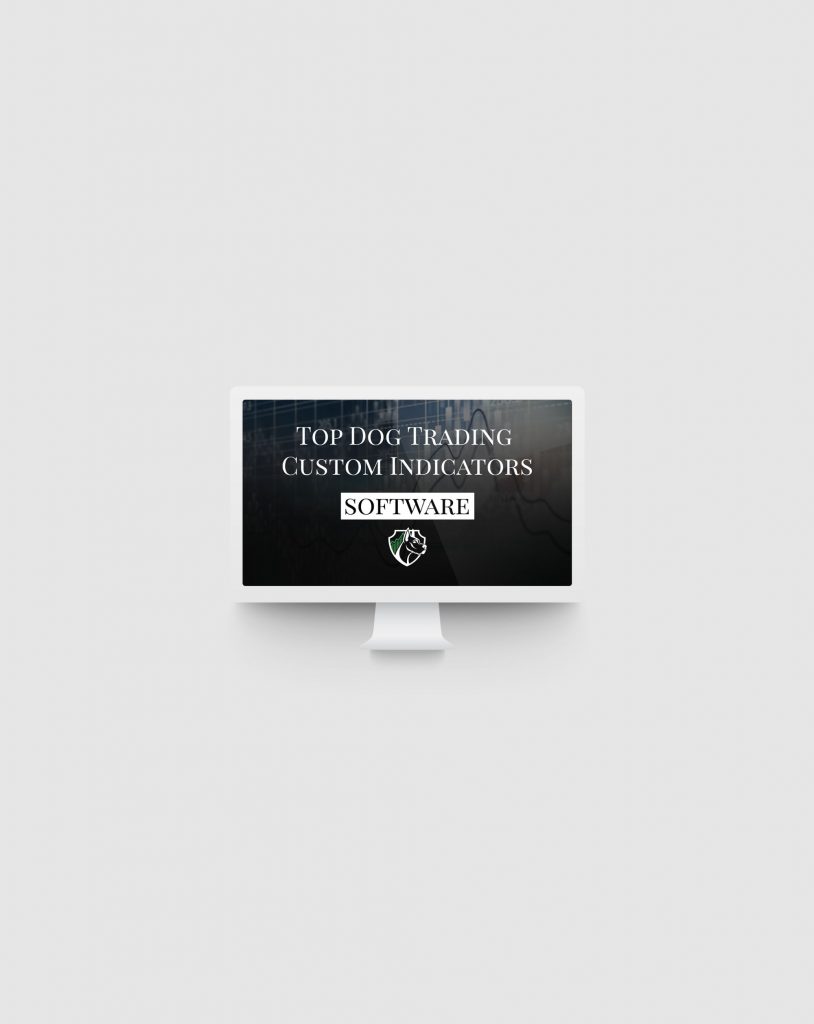
Top Dog Trading Custom Indicators
The Top Dog Trading 5-Energy Methodology doesn’t require any special or proprietary indicators. It’s a simple system that uses a couple of the most common indicators that are available on most any charting software. However, to help you read the trading and setup signals easier, I’ve created some custom indicators that:
- Color code the indicators.
- Automate the wave counts.
- Automatically draw “Second Chance Patterns” on your charts.
- Automatically draw Fibonacci levels.
- Automatically draw Floor Trader Pivots.
- Automatically draw significant swing highs and lows.
- Objectively color up trends and down trends.
- You can customize many aspects of the indicators for your -personal preference.
- Everything updates in real-time on the hard right edge of your chart.
The bottom line is that these custom indicators create CLARITY in seeing the chart setups, providing you to trade with more CONFIDENCE. These are the only 4 platforms we have the custom indicators for at this time. The features and functions of the custom indicators vary from one charting platform to another. Please refer to each order form for a list of which specific indicators are available for each of the charting platforms.
Video Newsletter Subscription
You’ll receive 3 videos (each is 15-30 minutes long) every week via email. These videos demonstrate in a dynamic manner our trading strategies and how they are being applied to various markets, in current market conditions.
Become an esteemed member of the Top Dog Trading community and you’ll receive 3 videos (each is approximately 15-30 minutes long) every week via email. These videos demonstrate in a dynamic manner our trading strategies and how they are being applied to various markets, in current market conditions.

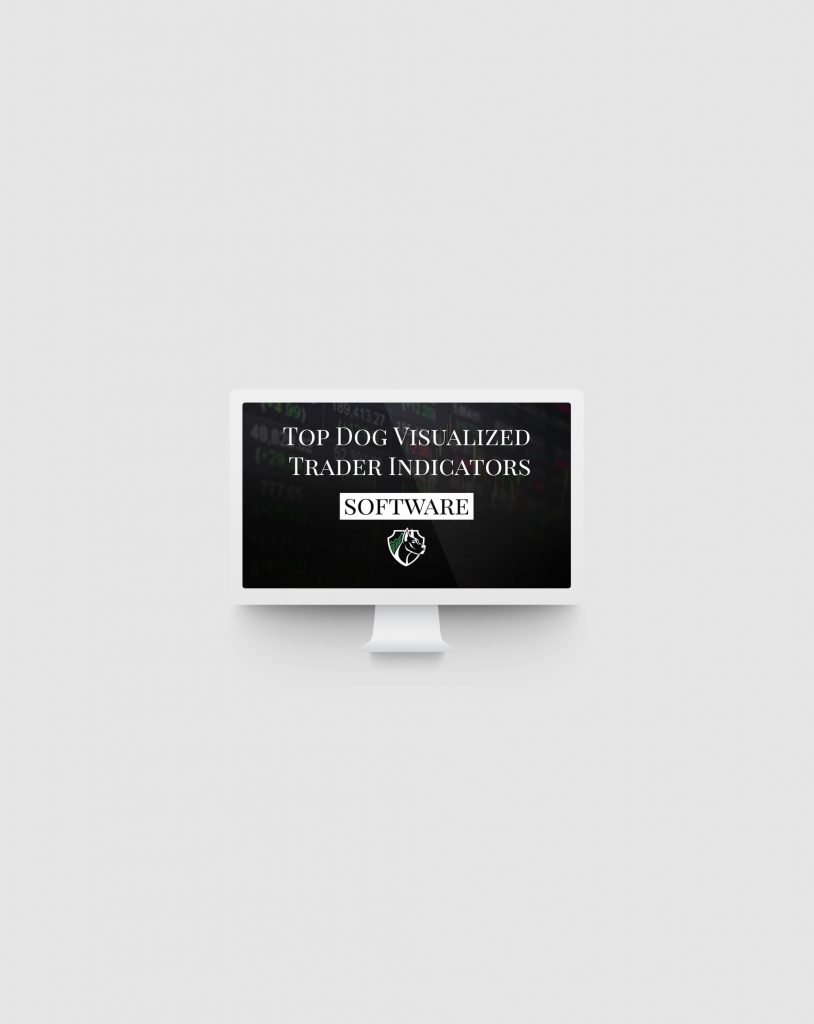
Visualized Trader Software
The Top Dog Visualized Trader software provides visual clarity for when the 5 Energies align across 3 different time intervals. It uses arrrows, colored boxes and audio alerts to tell you when those energies are aligned across mutliple time frames, making energy alignment clear and simple to see. This software suite is available only for “Think Or Swim”, “NinjaTrader” and “TradingView”.
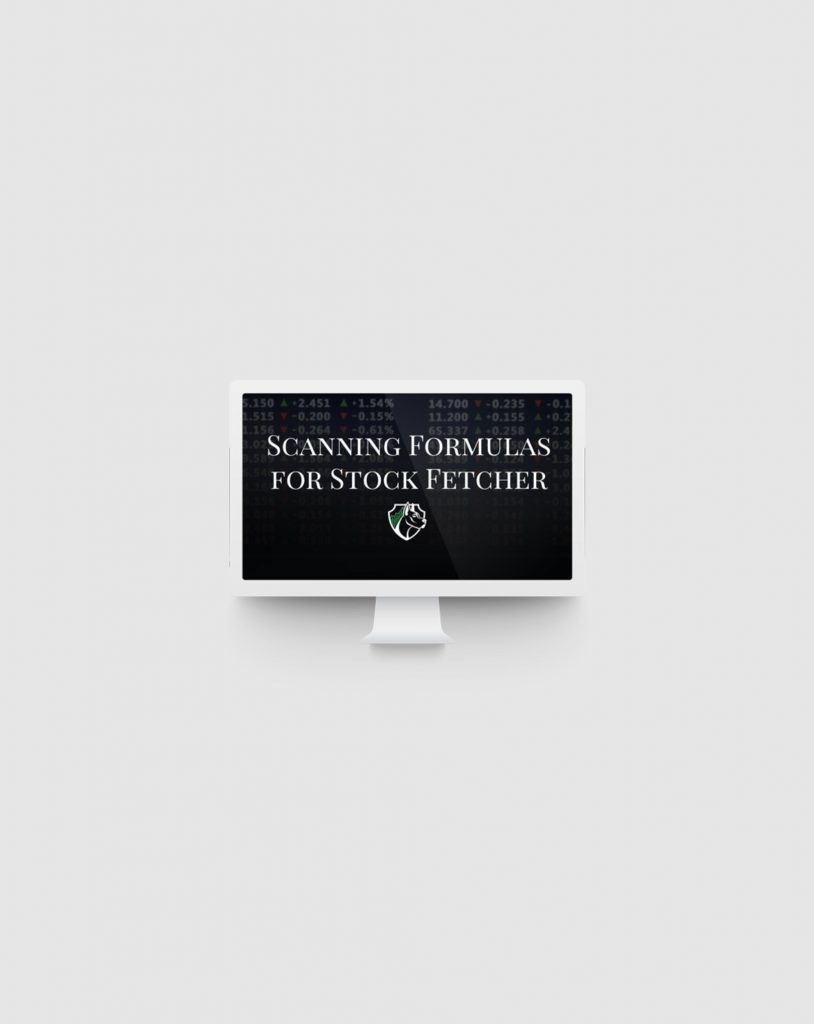
Scanning Formula for Stock Fetcher
I’ve received a lot of requests for help in scanning the stock market for stocks that are setting up for one of the Top Dog Trades, so now you can get … MY PERSONAL STOCK SCANNING FORMULAS… that I spent over 3 years developing!
These scans are used to find swing trades using the daily chart as the setup chart and the weekly chart as the confirmation charts (not for intraday trading). These scans are used for US stocks only (not Forex, futures or stocks in other countries).
No programming is required. Just copy and paste these formulas into the program (I’ll show you exactly how to do it, step-by-step in a video), click the button and get the results. It’s easy.
These scans are written in the programming language for the StockFetcher software which you’ll need to use the scans ($8.98/month payable directly to them – I have no financial connection with them).
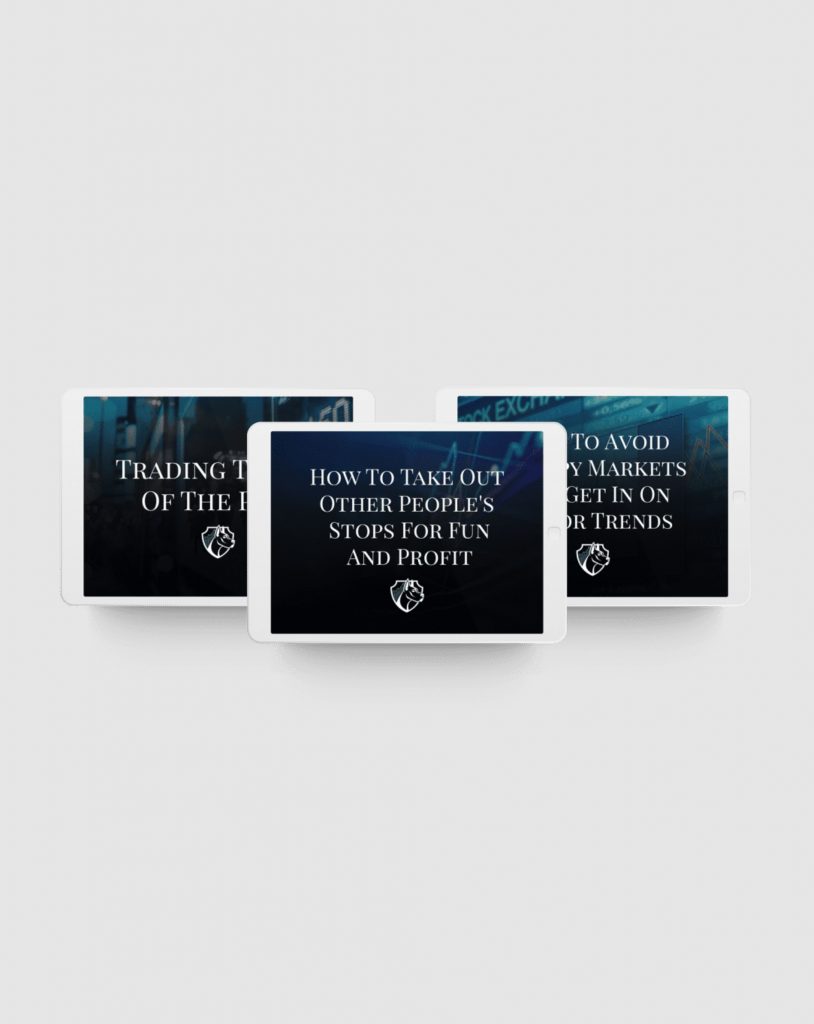
Top Dog Trading Special Reports
3 Special Reports Give You Professional Level Insights into Trading:
- Trading Tricks only the Pros Know.
- How to Stay out of Choppy Markets (and catch new mega-trends early.
- How to Avoid Getting Your Stops Run (and even profit when the professional trading hunt other people’s stops).
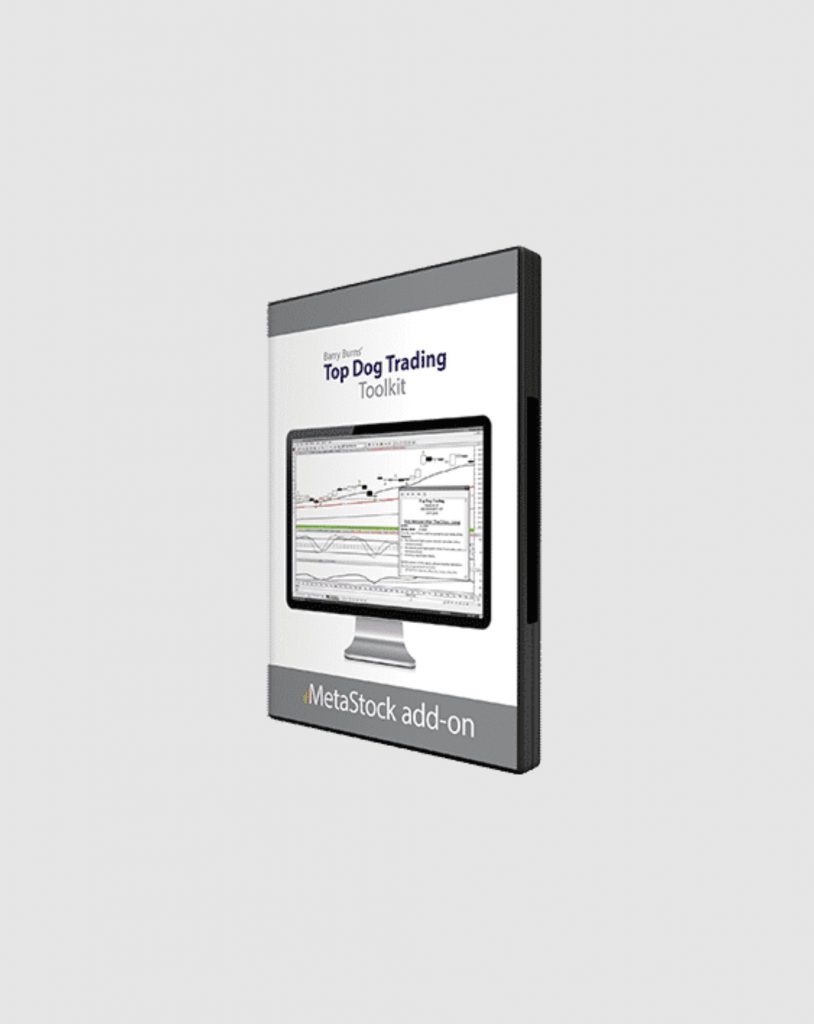
MetaStock Top Dog Trading Add-on
It’s been several YEARS in the making and it’s finally available: What’s it do?
- Allows you to Scan For Setups on both the Setup Chart and the Confirmation Chart for both long and short trades (trend trades, reversal trades, triangle trades, first cycle high/low after DAD turns trades, and rubber band trades).
- Labels buy/sell signals on the chart with arrows.
- Buy/sell signals come with a pop-up window that describes the trade setup, the rules of the setup, the price of the entry and the price of your stop … all displayed right on your computer screen with every buy/sell signal!
- Provide chart Templates for both the setup chart and the confirmation chart including all the indicators setup according to the Top Dog Trading parameters.
- Automatically plots on your charts: Wave counts, Trend indication ribbon, Fibonacci Levels, Swing Support/Resistance Levels, Floor Trader Pivots, “Second Chance” Cycle Patterns on the Cycle Indicator, Momentum. All this is available in the new MetaStock “Top Dog Trading Toolkit” (note: this software is only available through MetaStock – click below to be taken to the web page where they offer the plugin).
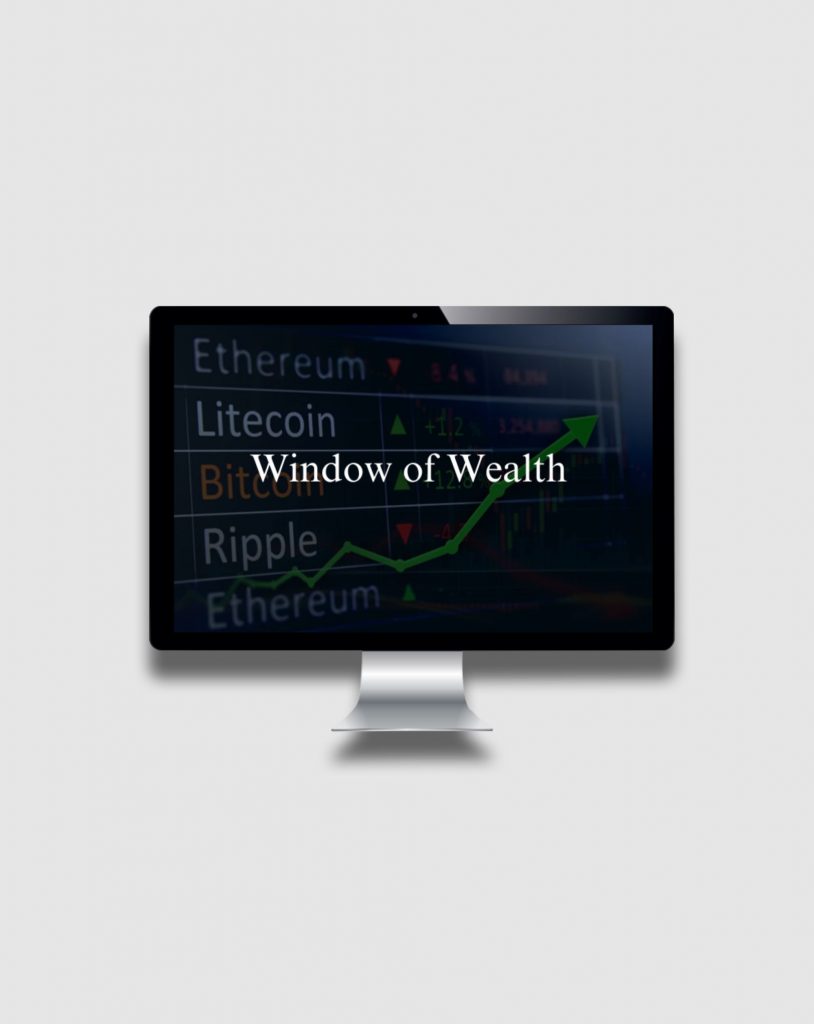
Cryptocurrency Window of Wealth
Here’s what you get:
- How to get into Explosive Moves up on Crypto BEFORE it takes off like a rocket!
- How to take advantage of Crypto Cycles for precision timing (warning: cycles in crypto are different than cycles in stocks, Forex, futures or options!)
- Exactly when to ENTER Cryptocurrency trades.
- Exactly when to EXIT Cryptocurrency trades.
- How to avoid chasing crypto moves.
- How to know find legitimate crypto opportunities and avoid the scams and the hype (careful – there are a lot of them!).
- SPECIFIC opportunities in the crypto market right NOW.
- How to make money beyond crypto with BLOCKCHAIN technology.
- How to make PASSIVE INCOME with crypto.
- The best TOOLS to use for trading and investing with crypto over and over again.
- The course includes 10 videos and a downloadable PDF summary to use in following along with the videos.
Options Trading WealthStyles
Step 1: Register to watch this Options Masterclass today.
Step 2: Learn my 5-step strategy for trading Options like a pro!
Step 3: Get an amazing opportunity to be personally mentored by me.
Step 4: Apply to become one of my top students and one of our top 1% of successful traders.